Are you looking for new ways to demonstrate event ROI? As a data-driven organization, we help event professionals everywhere analyze and improve their event performance with event KPIs.
Having completed both quantitative and qualitative research across thousands of events of all sizes and delivery formats, we’ve established a list of more than 150 KPIs. Here, we’ll describe the top 25 KPIs that event professionals are using to measure event success in 2023.
Before you dive into our list, here are a few things you should know.
What Are Event KPIs?
Event KPIs (key performance indicators) are the metrics used to measure the success of an event. Moreover, KPIs illustrate whether or not you’ve met your event goals. These metrics can be gathered using an event management platform. Event KPIs typically include attendee actions such as registration or session attendance and can vary based on the event.
How Have Event KPIs Changed Over the Years?
Before 2020, event teams had begun exploring new ways to measure engagement, such as gamification and RFID tags. When the COVID-19 pandemic struck, event teams began to measure virtual event performance out of necessity. These teams quickly discovered that duration and click tracking yielded rich virtual engagement metrics. Today, as more teams are delivering hybrid events, virtual actions are combined with on-site behaviors to increase organizations’ understanding of their event performance.
How to Determine What to Measure
Because every event is different, it’s important to evaluate the metrics that are most relevant to your organization. Before you begin tracking attendees’ actions, ask yourself, “Which metrics align with my goals?” and “How do these metrics demonstrate improvement?” Before you set KPIs for your upcoming event, look at how you measured events in the past. For example, if you’ve only ever measured registration, one of your goals may be to measure other actions for future events.
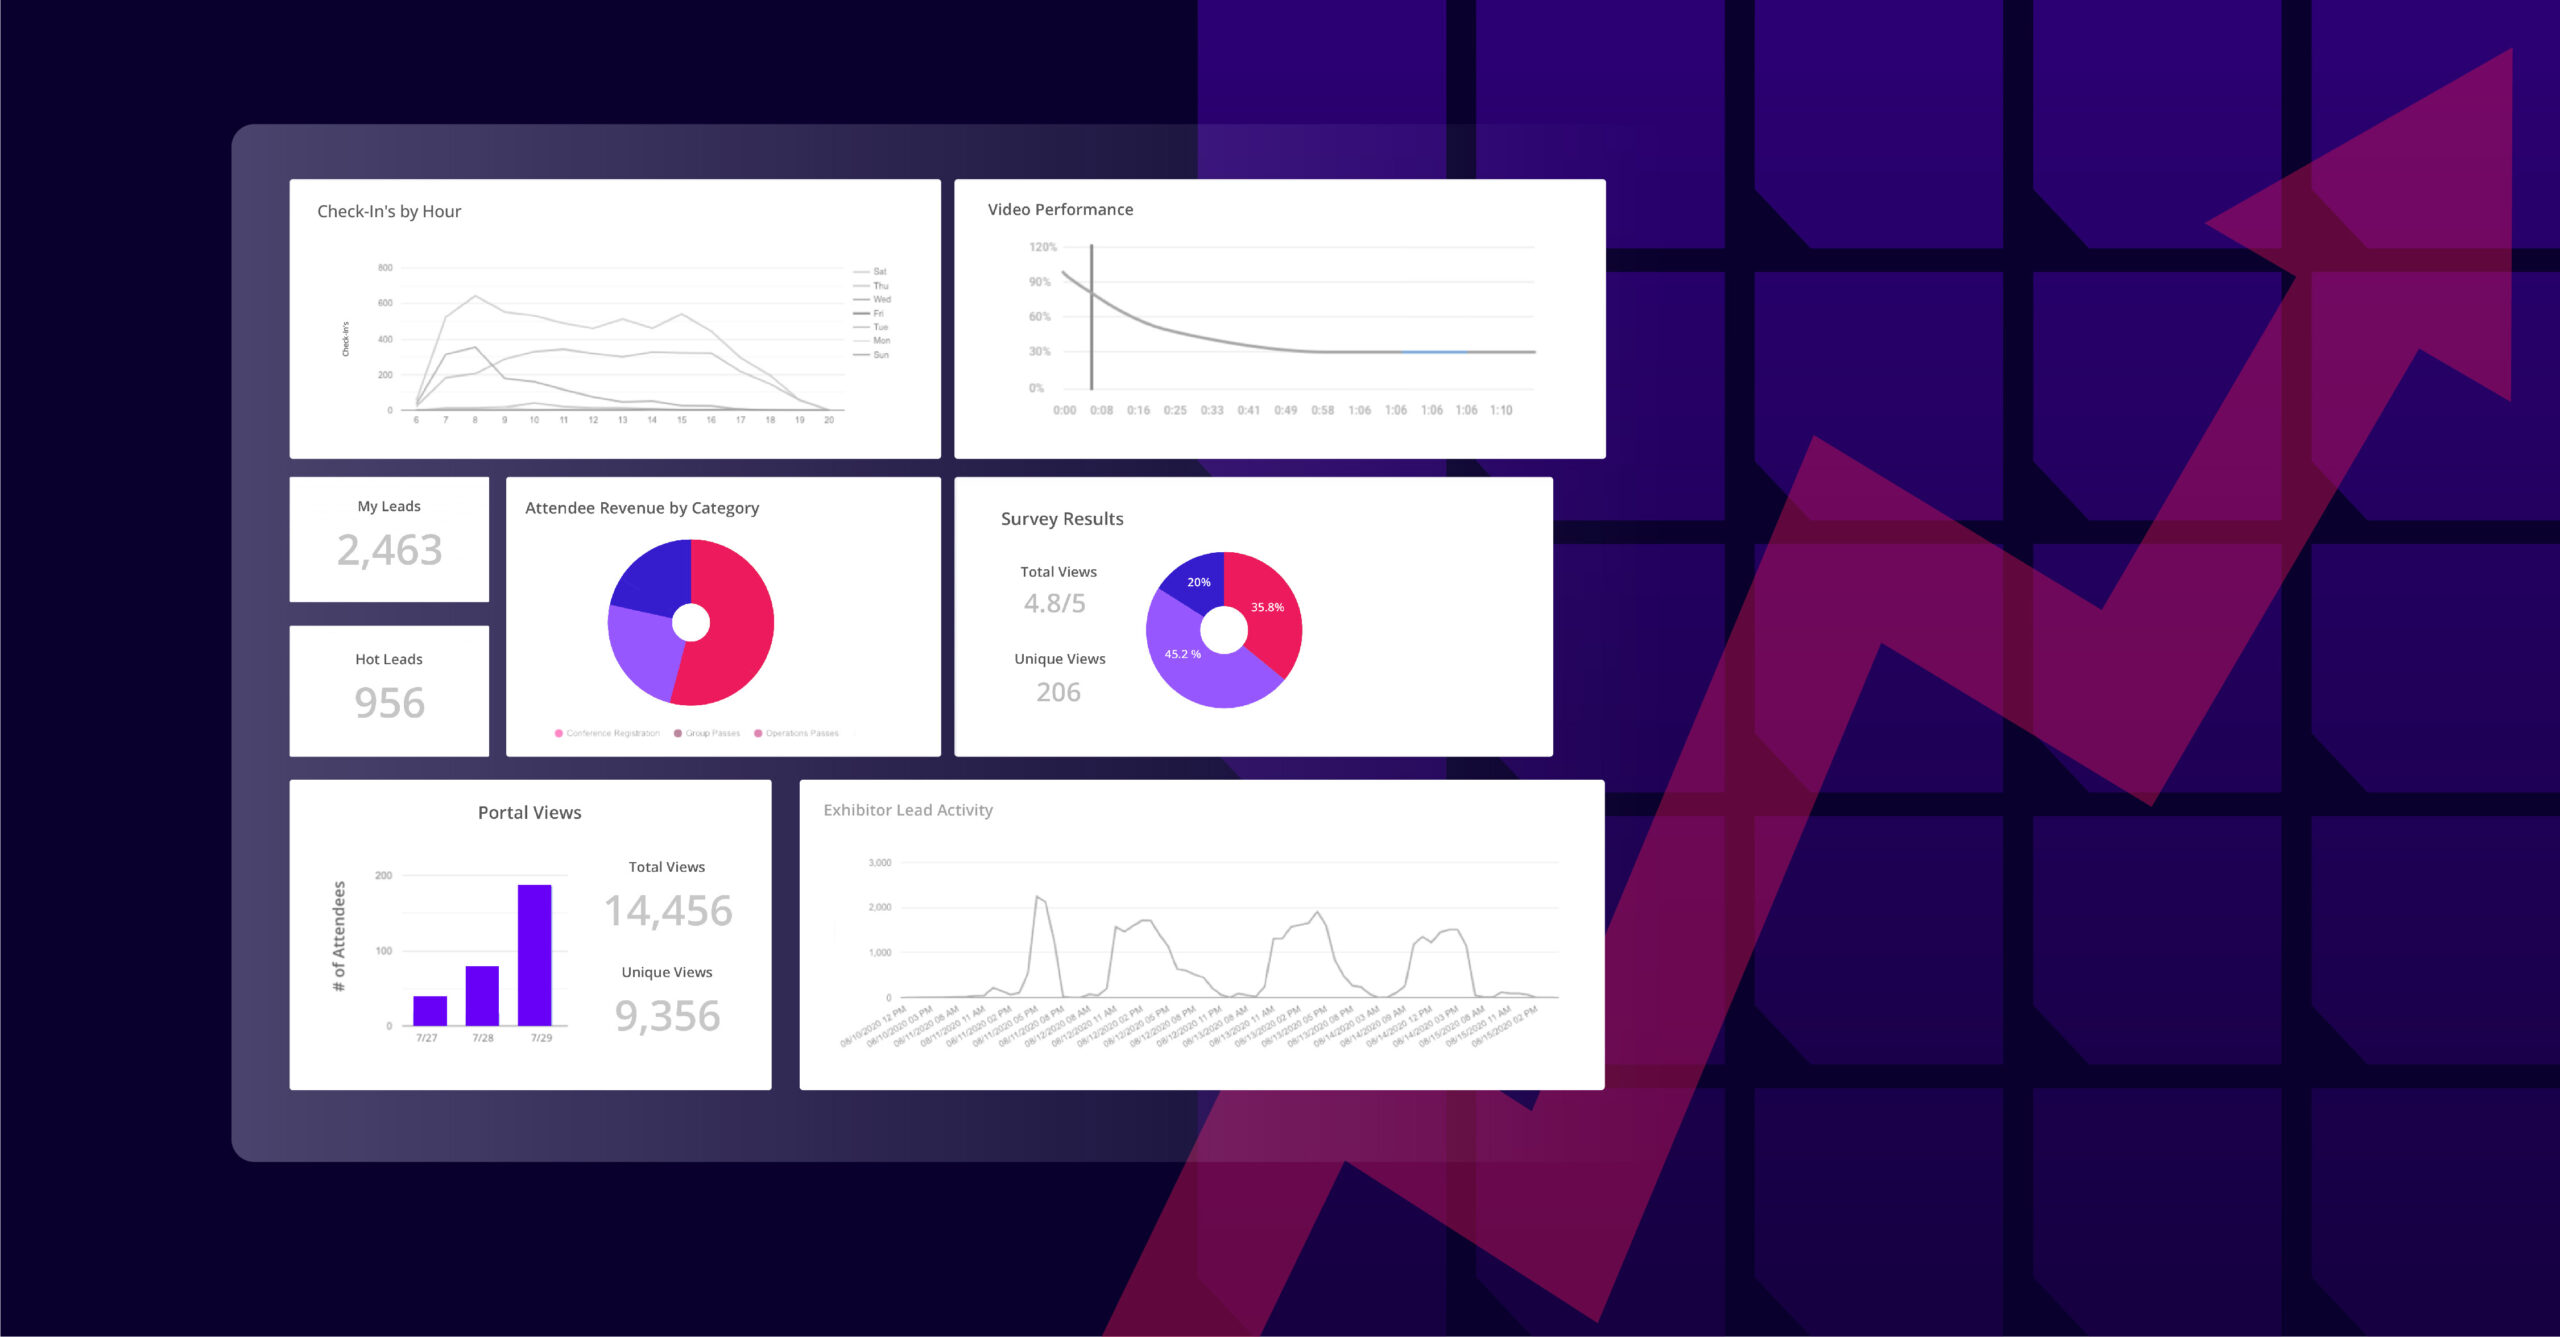
Here are the top 25 KPIs, along with a brief description of each:
- Registration campaign performance: Number of registrations attributed to a marketing campaign
- Registrations: Attendees who have completed their package and payment selection
- Registration abandonment rate: Percentage of unique users who started but failed to complete the registration workflow
- Speaker task completion: Percentage of tasks completed by speakers
- Exhibitor task completion: Percentage of tasks completed by exhibitors
- Package revenue: Sum of revenue collected by each unique package offered during registration
- Sponsorship revenue: Total revenue gathered through sponsorship and exhibitors for the event
- Event revenue: Total revenue collected by package sales, sponsorship and/or exhibitor sales
- Pipeline influenced: Value of leads and opportunities generated by those who attended and engaged with an event
- Sales generated: Deals won from those who attended and engaged with an event over a specific time period
- Session schedule rate: Average number of scheduled sessions selected by registered attendees
- Session participation rate: Percentage of checked-in attendees who scanned into an in-person session or joined a virtual session
- Average session attendance: Average count of sessions attended by attendees
- Activities per attendee: Average count of activities (e.g., sessions attended, meetings attended, booth visits) completed by an attendee
- 1:1 meeting participation rate: Percentage of attendees who took part in a 1:1 meeting
- Attendee satisfaction: Responses from event surveys
- Exhibitor participation rate: Percentage of attendees who visited an exhibitor booth, as counted by scans, visits, info requests, favoriting, and sponsored session attendance
- Exhibitor leads generated: Total number of unique leads sourced through attendees’ engagement with exhibitors
- Average leads: Average count of leads per exhibitor, including scans, visits, request info, favorites, and sponsored session attendance
- Sponsored session leads: Total number of leads a sponsor collects from hosting a session
- Cost per lead: Total sponsorship spend divided by the number of leads gathered
- Attendee/exhibitor meetings: Average count of 1:1 meetings per exhibitor
- Sponsor/exhibitor satisfaction: Results of sponsor/exhibitor surveys measuring the satisfaction of an event (typically Net Promoter Score®)
- Mobile app downloads: Percentage of registered attendees who downloaded the event’s mobile app
- Environmental impact: Amount of carbon emissions generated and/or offset by the event
What the Future Holds
The next evolution of event KPIs is the inclusion of marketing and sales data. Events represent a large, important part of the customer experience. In order to understand the full impact of events, organizations must establish integrations between their event management platform and their customer data profile (CDP). And to act on event metrics, they will also need to integrate their event management platform with their marketing automation platform (MAP).
So far, this shift has been slow. As of Q1 of 2023, more than half of marketing organizations had yet to integrate their event management technology with their CDP or MAP, according to this Forrester blog post. In the near future, we anticipate event teams will find that they can more effectively demonstrate ROI as they integrate these technologies.
We’re here to help you illuminate gaps in your event analysis. For a free consultation of to view the full list of event KPIs click here.